← Back to GiesFounded June 2024 · Three contributors · Last updated
About Gies.
A weekly newsletter and podcast on the video games industry. The newsletter is the news. The podcast is the conversation around the news.
Who writes Gies
Three contributors. Combined experience across gaming forecasting, live-service marketing, game design, journalism, and business development.
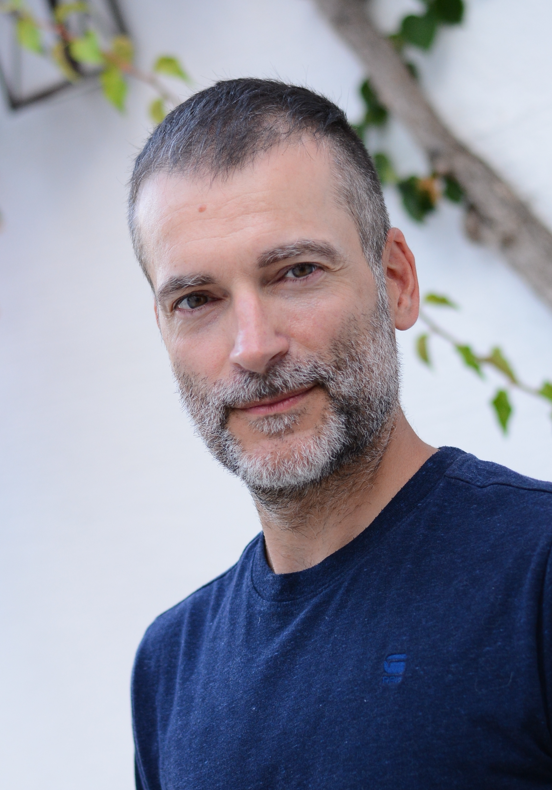
Emmanuel Rosier
The Analyst
Translates conceptual ideas into measurable metrics.
Manu is an authority on Competitive Intelligence, Market Research, and Demand Planning. Forty-plus years inside gaming as a player and a decade of professional involvement across the US, Europe, and Asia. Currently Director of Market Intelligence at Newzoo, after a decade at Electronic Arts working on franchises like Apex Legends, Battlefield, Star Wars Battlefront, and Need for Speed.
Builds the publishing playbook from inside the live-service trenches.
Casey is a gaming veteran with extensive experience creating, marketing and operating live-service games. Has executed global marketing and business strategies for franchises including Helldivers, Battlefield, Need for Speed, Command & Conquer, Mirrors Edge, and Ultima. Currently helps smaller studios get funded or strike publishing deals.
Business developmentLive-service marketingFranchise strategyPublishing dealsStudio funding
Reads games like a designer, writes them like a journalist.
David is a Game Design, Marketing and Communications consultant with experience on 40+ titles ranging from AAA blockbusters to indie farming sims, plus 10 years as a journalist at Forbes covering video games and 2 years leading communications at PlayerUnknown Productions. Works at all stages of a project, from pitch presentation to early prototypes and near-release products.
Game designMarketing & communicationsGames journalismPre-launch strategyProject lifecycle
Gies (Games Industry Executive Summary) was founded by Emmanuel Rosier in June 2024, with co-founder Casey Al-Kaisy, to make sense of the video games industry for people with little time. Three things, that's it.
Read weekly
Newsletter (Friday)
Read monthly
Takeaway (deeper read)
Watch and listen
Podcast (YouTube)
The weekly newsletter
The factual digest. Every Friday morning, the key gaming industry news of the past 7 days, curated and condensed. No opinion. No long analysis. Designed to be consulted, not absorbed. If you have ten minutes a week to follow the industry, this is for you.
Once a month, David Thier (and guests) write a longer, opinionated piece on something that mattered. Slower, deeper, with a point of view.
On the same Substack, paid tier ($5/month).
The podcast
Every week on YouTube. Casey hosts. Emmanuel walks through the week's news as the analyst. David adds the design and player-culture lens. Patrick Rose and Andre Persson drop in as recurring guests. There's also a "Guess the game" segment to keep things light.